Reports
Whautomate gives you three ways to see how your business is doing:
- The Overview dashboard: today at a glance, the first page you see after logging in.
- The Performance Report: a weekly scorecard comparing each week with the one before, in the app and by email.
- Reports: detailed reports you can filter by date, team member, service, channel and more, and export to Excel.
Open Reports
In the sidebar, click Reports. The reports hub groups the reports by question:
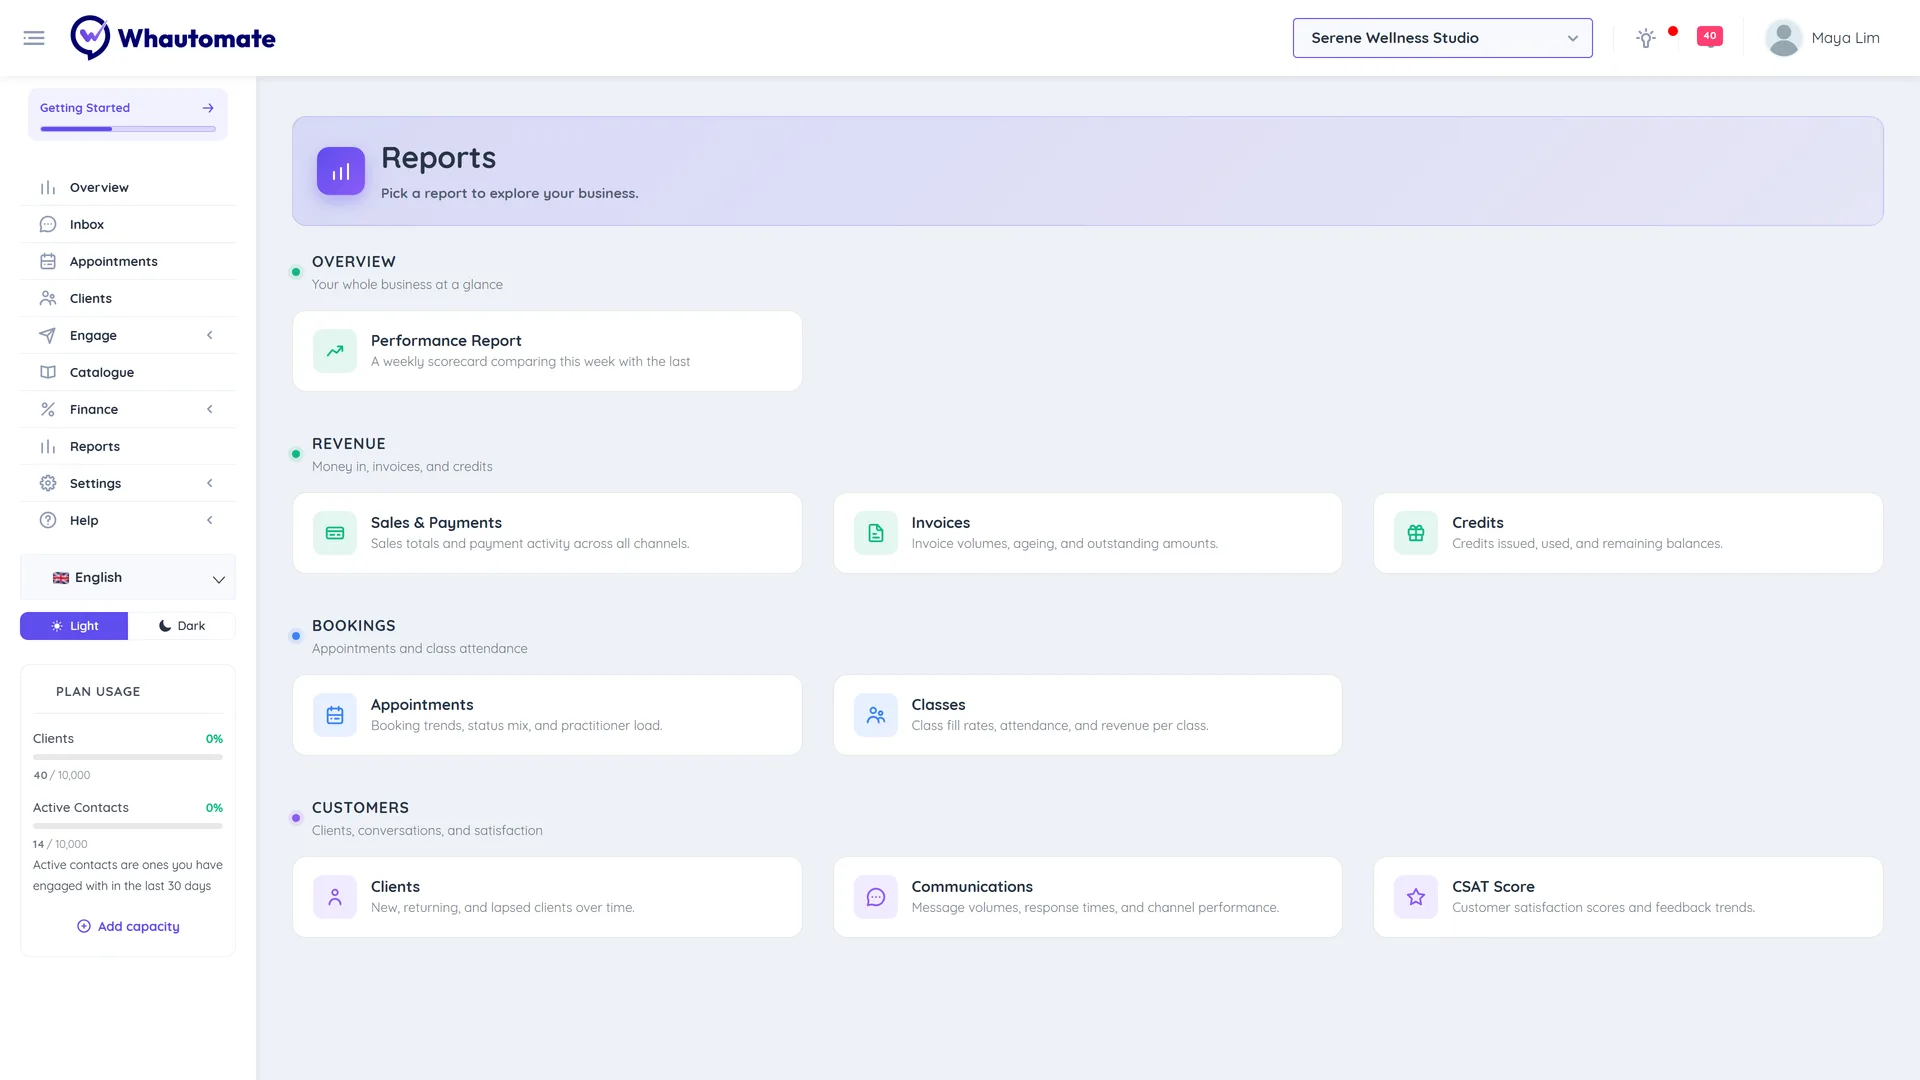
| Group | Report | What it answers | Needs |
|---|---|---|---|
| Overview | Performance Report | How did this week compare with the last? | Every plan |
| Revenue | Sales & Payments | Sales totals and payment activity. Opens the Payments page. | Bookings or Sales |
| Revenue | Invoices | Invoice volumes, paid, outstanding and refunded amounts | Sales |
| Revenue | Credits | Credits issued, used and remaining | Sales |
| Bookings | Appointments | Booking trends, status mix and team workload | Bookings |
| Bookings | Classes | Class fill rates, attendance and top clients | Bookings |
| Customers | Clients | New clients, referral sources and top clients by revenue | CRM Suite, plus Bookings or Sales |
| Customers | Communications | Message volumes, agent activity and peak hours | Every plan |
| Customers | CSAT Score | Customer satisfaction scores and feedback | Every plan |
Reports whose module is not in your plan are hidden from the hub. See Plan Modules.
Who can see reports
- Owners, Administrators and the Accountant/Finance Manager role can open Reports. Other roles cannot.
- An owner or administrator can hide Reports from one of these team members with No Report Module Access.
- Sales & Payments and Invoices also need finance access, and Communications needs communication access.
How the reports work
- Most reports open on This Month. Click the date button under Filter by Date to choose This Month, Last Month, Last 3 Months, Last 6 Months or your own Start Date and End Date.
- Change the filters and click Run Report. Click Reset Filters to go back to the defaults.
- Reports show the workspace you are in. Switch workspace to see another location. See Workspaces.
- Dates follow your account timezone. See Account Settings.
- Export Excel downloads the list behind the report, up to 2,500 rows. For full data exports, use Data Exports.